1、使用Visual Studio 2017创建一个Python工程,Python采用3.6版本,Python需要安装matplotlib和sklearn库
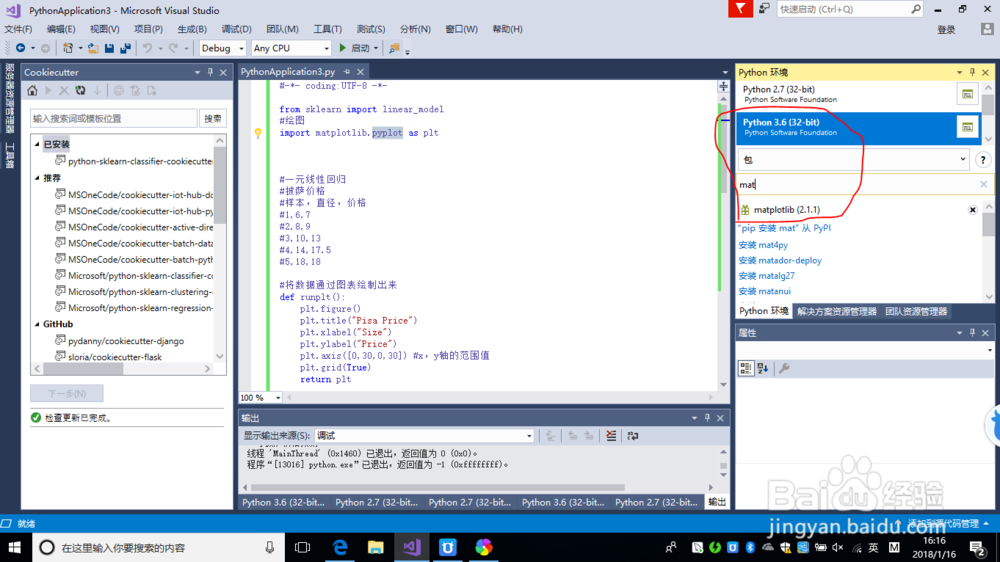

2、在Python 文件中需要引入sklearn的线性模型和matplotlib绘图包
from sklearn import linear_model
#绘图
import matplotlib.pyplot as plt
3、我们选择一元线性回归的算法,这里我们使用如下样例数据“披萨价格和披萨尺寸的关系”
数据如下:
#样本,直径,价格
#1,6,7
#2,8,9
#3,10,13
#4,14,17.5
#5,18,18
将数据绘制成图表
#将数据通过图表绘制出来
def runplt():
plt.figure()
plt.title("Pisa Price")
plt.xlabel("Size")
plt.ylabel("Price")
plt.axis([0,30,0,30]) #x,y轴的范围值
plt.grid(True)
return plt
plt = runplt()
x=[[6],[8],[10],[14],[18]]
y=[[7],[9],[13],[17.5],[18]]
plt.plot(x,y,'k.')
plt.show()

4、使用一元线性回归模型进行训练我们的数据,并预测单个值
如我们采用步骤3的数据训练模型后,预测12寸的披萨价格:
#线性回归模型
reg = linear_model.LinearRegression()
reg.fit(x,y)
#回归系数
rst=reg.coef_
print("回归系数%s" %rst)
print("12寸披萨价格预测:%.2f" % reg.predict([[12]]))

5、使用一元线性回归模型预测多个值,并在通过图的方式绘制出来
#预测多个值,并绘图
plt=runplt()
plt.plot(x,y,'k.')
x2=[[0],[10],[17],[20]] #多个尺寸
model=linear_model.LinearRegression()
model.fit(x,y) #训练模型
y2 = model.predict(x2) #预测值
plt.plot(x,y,'k*') # 黑点绘制 ,(+,.,-,*等)
plt.plot(x2,y2,'r-')#绿色线条 ,
plt.show()

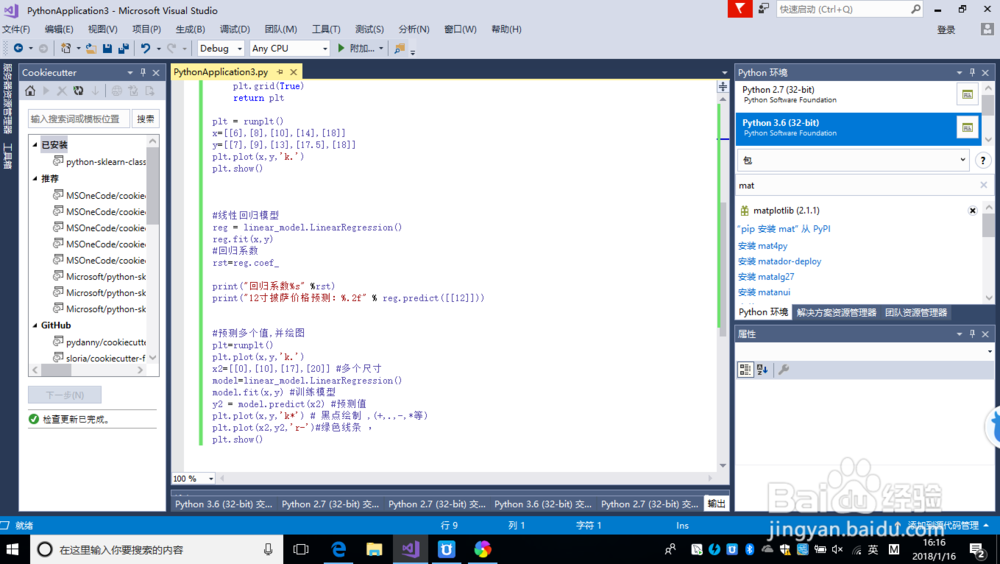
6、完成的python代码如下:
#-*- coding:UTF-8 -*-
from sklearn import linear_model
#绘图
import matplotlib.pyplot as plt
#一元线性回归
#披萨价格
#样本,直径,价格
#1,6,7
#2,8,9
#3,10,13
#4,14,17.5
#5,18,18
#将数据通过图表绘制出来
def runplt():
plt.figure()
plt.title("Pisa Price")
plt.xlabel("Size")
plt.ylabel("Price")
plt.axis([0,30,0,30]) #x,y轴的范围值
plt.grid(True)
return plt
plt = runplt()
x=[[6],[8],[10],[14],[18]]
y=[[7],[9],[13],[17.5],[18]]
plt.plot(x,y,'k.')
plt.show()
#线性回归模型
reg = linear_model.LinearRegression()
reg.fit(x,y)
#回归系数
rst=reg.coef_
print("回归系数%s" %rst)
print("12寸披萨价格预测:%.2f" % reg.predict([[12]]))
#预测多个值,并绘图
plt=runplt()
plt.plot(x,y,'k.')
x2=[[0],[10],[17],[20]] #多个尺寸
model=linear_model.LinearRegression()
model.fit(x,y) #训练模型
y2 = model.predict(x2) #预测值
plt.plot(x,y,'k*') # 黑点绘制 ,(+,.,-,*等)
plt.plot(x2,y2,'r-')#绿色线条 ,
plt.show()