1、Plot[f,{x, xmin,xmax]
这个是画一个图的命令,其中f是函数,x是自变量,xmin与xmax是区间的范围。

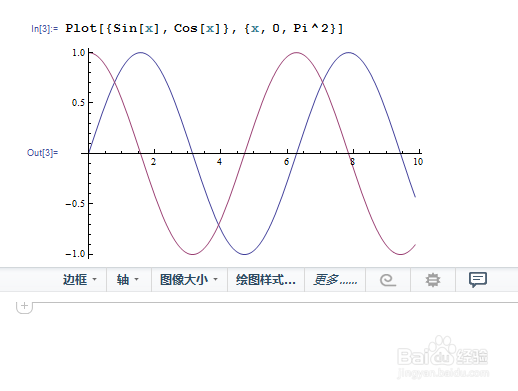
2、如果你需要把多个函数画在一张图上,可以使用如下命令:
Plot[{f,g},{x, xmin,xmax]
3、如果需要填充图像,可以使用
Plot[{Sin[x], Cos[x]}, {x, 0, Pi^2}, Filling -> Bottom]

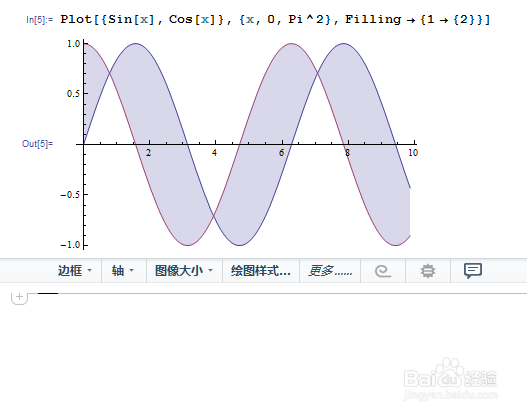
4、这个是填充两个图像之间的重合区域。
Plot[{Sin[x], Cos[x]}, {x, 0, Pi^2}, Filling -> {1 -> {2}}]
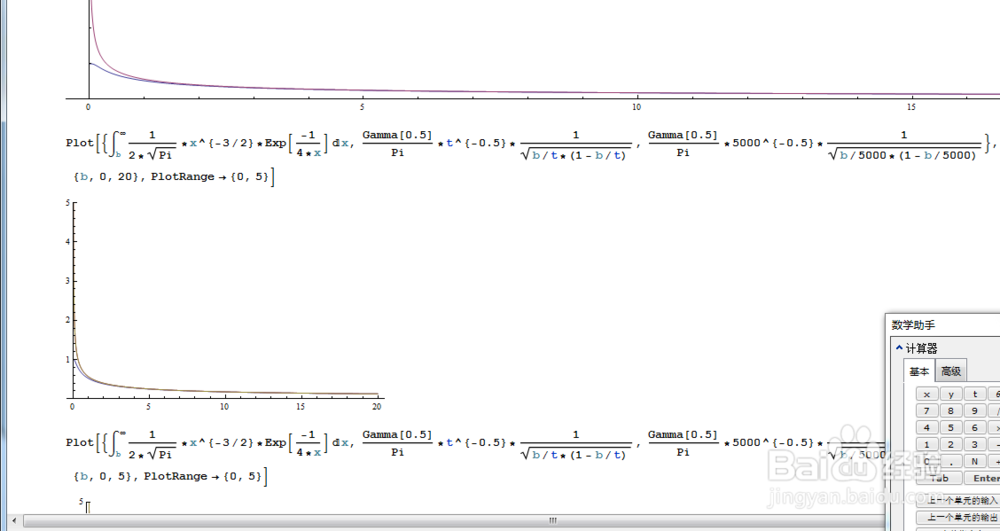
5、如果需要把定义域内的图像全部显示出来,通过PlotRange如下方式实现。
6、mathematic画图需要多实践,方法不是很难。只需要记住相关的命令即可。
