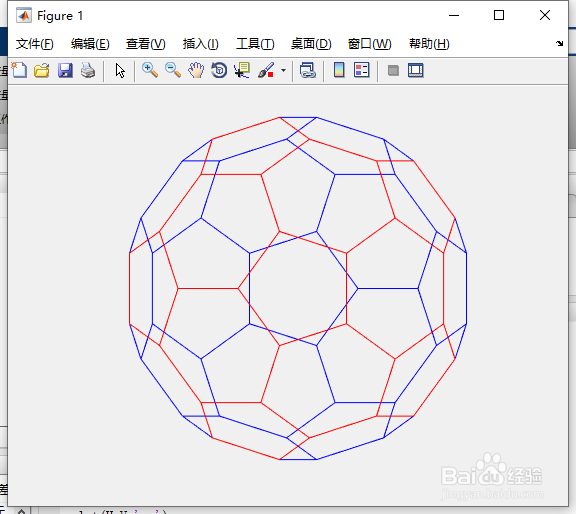
1、命令行窗口键入:
% Define the variables.
[B,V] = bucky;
H = sparse(60,60);
k = 31:60;
H(k,k) = B(k,k);
% Visualize the variables.
gplot(B-H,V,'b-');
hold on
gplot(H,V,'r-');
hold off
axis off equal
2、按”Enter“键。
如图1所示。
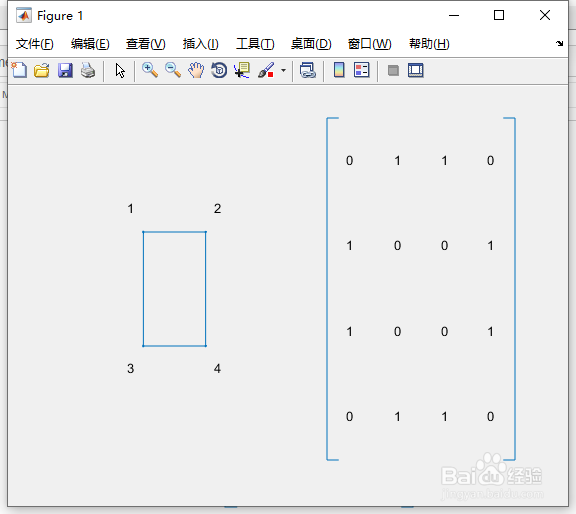
3、一个图可以用它的邻接矩阵来表示。
为了构造邻接矩阵,将节点编号为1到N。
如果节点i连接到节点j,则将矩阵的元素(i,j)设置为1,否则设置为0。
命令行窗口键入:
% Define a matrix A.
A = [0 1 1 0 ; 1 0 0 1 ; 1 0 0 1 ; 0 1 1 0];
% Draw a picture showing the connected nodes.
cla
subplot(1,2,1);
gplot(A,[0 1;1 1;0 0;1 0],'.-');
text([-0.2, 1.2 -0.2, 1.2],[1.2, 1.2, -.2, -.2],('1234')', ...
'HorizontalAlignment','center')
axis([-1 2 -1 2],'off')
% Draw a picture showing the adjacency matrix.
subplot(1,2,2);
xtemp = repmat(1:4,1,4);
ytemp = reshape(repmat(1:4,4,1),16,1)';
text(xtemp-.5,ytemp-.5,char('0'+A(:)),'HorizontalAlignment','center');
line([.25 0 0 .25 NaN 3.75 4 4 3.75],[0 0 4 4 NaN 0 0 4 4])
axis off tight
4、按”Enter“键。
如图2所示。
5、这里的节点在一个半球的巴克球,编号多边形的多边形。
命令行窗口键入:
subplot(1,1,1);
gplot(B(1:30,1:30),V(1:30,:),'b-');
for j = 1:30,
text(V(j,1),V(j,2),int2str(j),'FontSize',10);
end
axis off equal
6、按”Enter“键。
如图3所示。

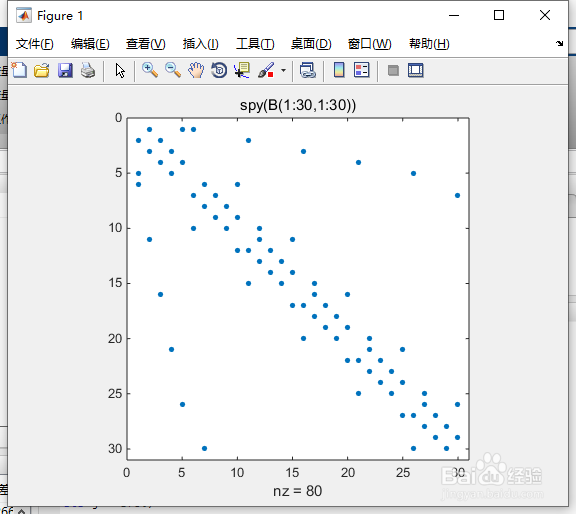
7、为了可视化这个半球的邻接矩阵,我们使用SPY函数来绘制非零元素的轮廓。
注意,矩阵是对称的,因为如果节点i连接到节点j,那么节点j连接到节点i。
命令行窗口键入:
spy(B(1:30,1:30))
title('spy(B(1:30,1:30))')
8、按”Enter“键。
如图4所示。
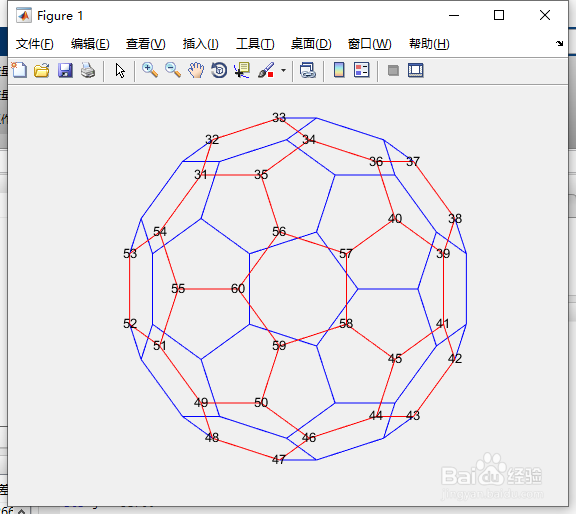
9、现在我们通过将一个半球的编号映射到另一个半球,将我们的编号方案扩展到整个图形。
命令行键入:
[B,V] = bucky;
H = sparse(60,60);
k = 31:60;
H(k,k) = B(k,k);
gplot(B-H,V,'b-');
hold on
gplot(H,V,'r-');
for j = 31:60
text(V(j,1),V(j,2),int2str(j), ...
'FontSize',10,'HorizontalAlignment','center');
end
hold off
axis off equal
10、按”Enter“键。
如图5所示。
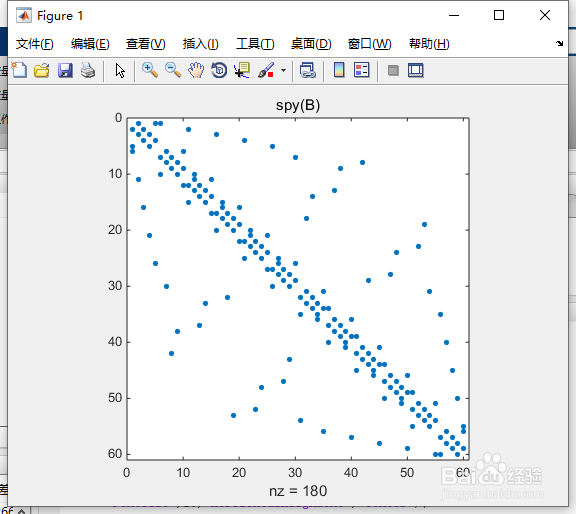
11、最后,这里是最终稀疏矩阵的间谍图。
命令行键入:
spy(B)
title('spy(B)')
12、按”Enter“键。
如图6所示。
13、在许多有用的图中,每个节点只连接到少数其他节点。
因此,邻接矩阵每行只包含几个非零项。
这个例子展示了一个稀疏矩阵有用的地方。
命令行窗口键入:
gplot(B-H,V,'b-');
axis off equal
hold on
gplot(H,V,'r-');
hold off
14、按”Enter“键。
如图7所示。
