1、第一步首先百度文库:magnify matlab源程序;找到对应的代码。

2、找到代码之后,我们将里面的源程序代码,复制到matlab新建的m文件。注意文件名为:magnify
备注:本经验的最后也给出了matlab m文件代码。直接复制即可。

3、自己用matlab画一个图像,然后在matlab命令窗口输入:magnify

4、点击鼠标左键,在图片上移动你会发现,鼠标所指的地方,会放大!
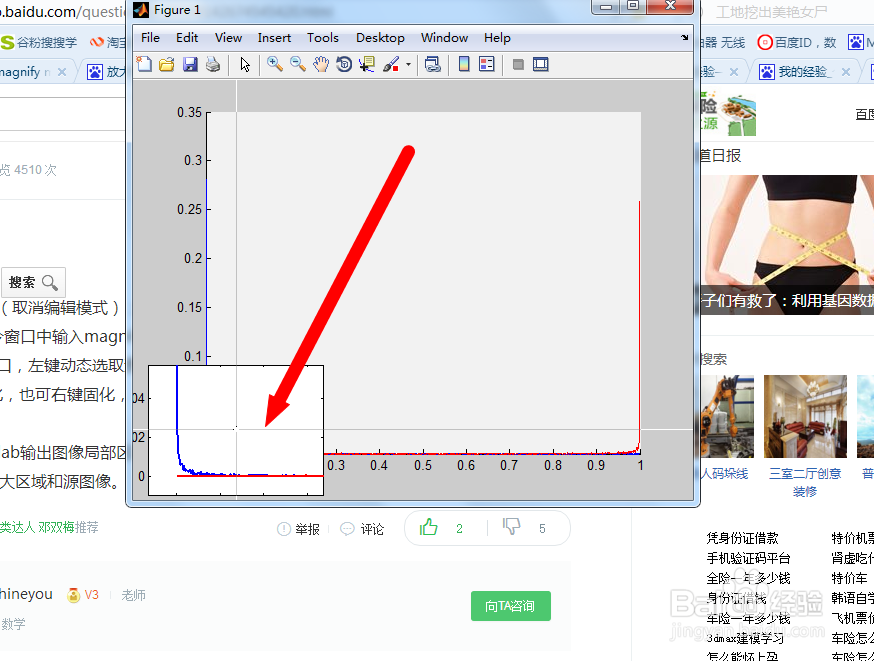
5、ctrl+左键固化,也可右键固化选择合适的放大区域。 如果选择错了暂时不用管它,等会可以删除!

6、点击图片左上的箭头,图片进入编辑模式。这样你可以修改,移动,甚至删除放大的区域。
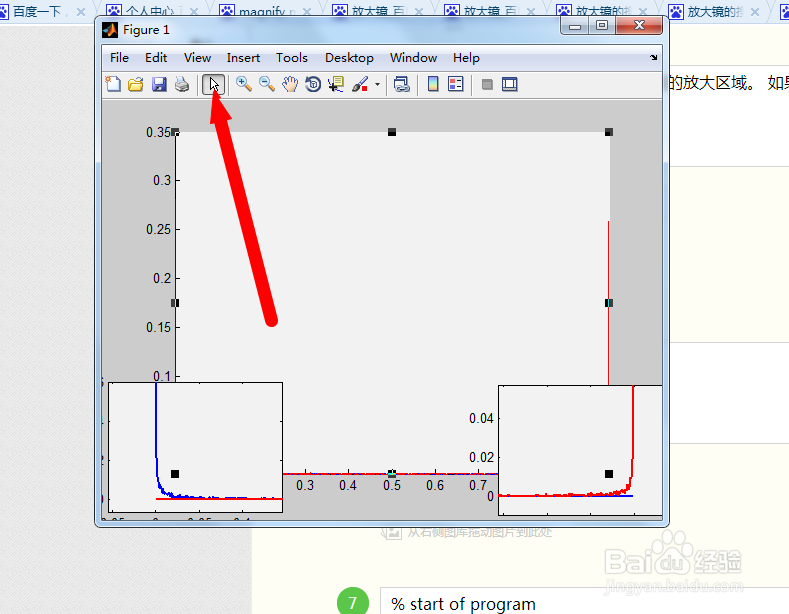
7、通过移动和删除,即保持了图像的完整性,又能凸出我们需要强调的部分。

8、% start of program
function magnify(f1)
% magnify(f1)
% Figure creates a magnification box when under the mouse position when a button is pressed. Press '+'/'-' while
% button pressed to increase/decrease magnification. Press '>'/'<' while button pressed to increase/decrease box size.
% Hold 'Ctrl' while clicking to leave magnification on figure.
%
% Example:
% plot(1:100,randn(1,100),(1:300)/3,rand(1,300)), grid on,
% magnify;
if (nargin == 0), f1 = gcf; end;
figure(f1);
set(f1, ...
'WindowButtonDownFcn', @ButtonDownCallback, ...
'WindowButtonUpFcn', @ButtonUpCallback, ...
'WindowButtonMotionFcn', @ButtonMotionCallback, ...
'KeyPressFcn', @KeyPressCallback);
return;
function ButtonDownCallback(src,eventdata)
f1 = src;
a1 = get(f1,'CurrentAxes');
a2 = copyobj(a1,f1);
set(f1, ...
'UserData',[f1,a1,a2], ...
'Pointer','fullcrosshair', ...
'CurrentAxes',a2);
set(a2, ...
'UserData',[2,0.2], ... %magnification, frame size
'Color',get(a1,'Color'), ...
'Box','on');
xlabel(''); ylabel(''); zlabel(''); title('');
set(get(a2,'Children'), ...
'LineWidth', 2);
set(a1, ...
'Color',get(a1,'Color')*0.95);
set(f1, ...
'CurrentAxes',a1);
ButtonMotionCallback(src);
return;
function ButtonUpCallback(src,eventdata)
H = get(src,'UserData');
f1 = H(1); a1 = H(2); a2 = H(3);
set(a1, ...
'Color',get(a2,'Color'));
set(f1, ...
'UserData',[], ...
'Pointer','arrow', ...
'CurrentAxes',a1);
if ~strcmp(get(f1,'SelectionType'),'alt'),
delete(a2);
end;
return;
function ButtonMotionCallback(src,eventdata)
H = get(src,'UserData');
if ~isempty(H)
f1 = H(1); a1 = H(2); a2 = H(3);
a2_param = get(a2,'UserData');
f_pos = get(f1,'Position');
a1_pos = get(a1,'Position');
[f_cp, a1_cp] = pointer2d(f1,a1);
set(a2,'Position',[(f_cp./f_pos(3:4)) 0 0]+a2_param(2)*a1_pos(3)*[-1 -1 2 2]);
a2_pos = get(a2,'Position');
set(a2,'XLim',a1_cp(1)+(1/a2_param(1))*(a2_pos(3)/a1_pos(3))*diff(get(a1,'XLim'))*[-0.5 0.5]);
set(a2,'YLim',a1_cp(2)+(1/a2_param(1))*(a2_pos(4)/a1_pos(4))*diff(get(a1,'YLim'))*[-0.5 0.5]);
end;
return;
function KeyPressCallback(src,eventdata)
H = get(gcf,'UserData');
if ~isempty(H)
f1 = H(1); a1 = H(2); a2 = H(3);
a2_param = get(a2,'UserData');
if (strcmp(get(f1,'CurrentCharacter'),'+') | strcmp(get(f1,'CurrentCharacter'),'='))
a2_param(1) = a2_param(1)*1.2;
elseif (strcmp(get(f1,'CurrentCharacter'),'-') | strcmp(get(f1,'CurrentCharacter'),'_'))
a2_param(1) = a2_param(1)/1.2;
elseif (strcmp(get(f1,'CurrentCharacter'),'<') | strcmp(get(f1,'CurrentCharacter'),','))
a2_param(2) = a2_param(2)/1.2;
elseif (strcmp(get(f1,'CurrentCharacter'),'>') | strcmp(get(f1,'CurrentCharacter'),'.'))
a2_param(2) = a2_param(2)*1.2;
end;
set(a2,'UserData',a2_param);
ButtonMotionCallback(src);
end;
return;
% Included for completeness (usually in own file)
function [fig_pointer_pos, axes_pointer_val] = pointer2d(fig_hndl,axes_hndl)
%
%pointer2d(fig_hndl,axes_hndl)
%
%Returns the coordinates of the pointer (in pixels)
%in the desired figure (fig_hndl) and the coordinates
% in the desired axis (axes coordinates)
%
% Example:
% figure(1),
% hold on,
% for i = 1:1000,
% [figp,axp]=pointer2d;
% plot(axp(1),axp(2),'.','EraseMode','none');
% drawnow;
% end;
% hold off
% Rick Hindman - 4/18/01
if (nargin == 0), fig_hndl = gcf; axes_hndl = gca; end;
if (nargin == 1), axes_hndl = get(fig_hndl,'CurrentAxes'); end;
set(fig_hndl,'Units','pixels');
pointer_pos = get(0,'PointerLocation');%pixels {0,0} lower left
fig_pos = get(fig_hndl,'Position');%pixels {l,b,w,h}
fig_pointer_pos = pointer_pos - fig_pos([1,2]);
set(fig_hndl,'CurrentPoint',fig_pointer_pos);
if (isempty(axes_hndl)),
axes_pointer_val = [];
elseif (nargout == 2),
axes_pointer_line = get(axes_hndl,'CurrentPoint');
axes_pointer_val = sum(axes_pointer_line)/2;
end;
% end of program