1、先来运行一组代码:
# -*- coding: utf-8 -*-
import matplotlib.pyplot as plt
from matplotlib import animation
import numpy as np
import math
def xin():
t = np.linspace(0, math.pi*2, 1000)
x = np.cos(3*t)
y = np.sin(2*t)
plt.plot(x, y, color='blue',
linewidth=2, label='圆')
plt.xlabel('t')
plt.ylabel('h')
plt.ylim(-1, 1)
plt.xlim(-1.5,1.5)
plt.legend()
plt.show()
xin()
绘图区间经过调整猜得到这个图形,否则图片就是压扁的。

2、然后分析代码。
加载扩展包之后,先来自定义一个绘图函数——xin()。
在末尾调用这个函数。
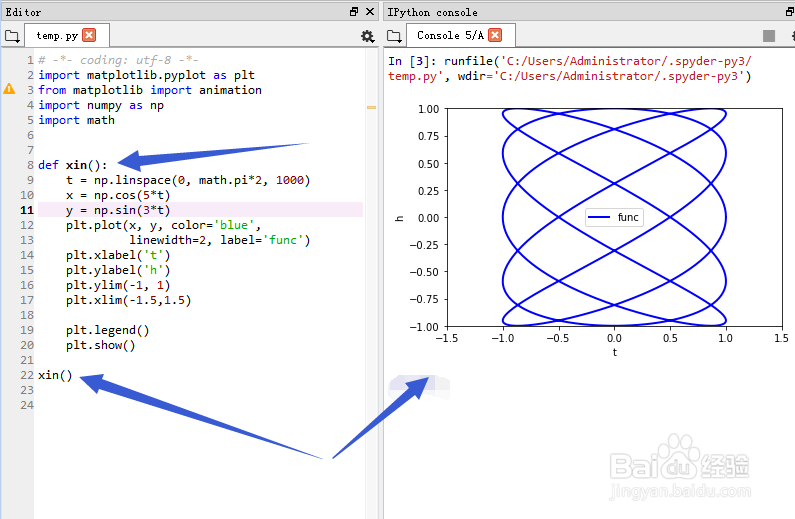
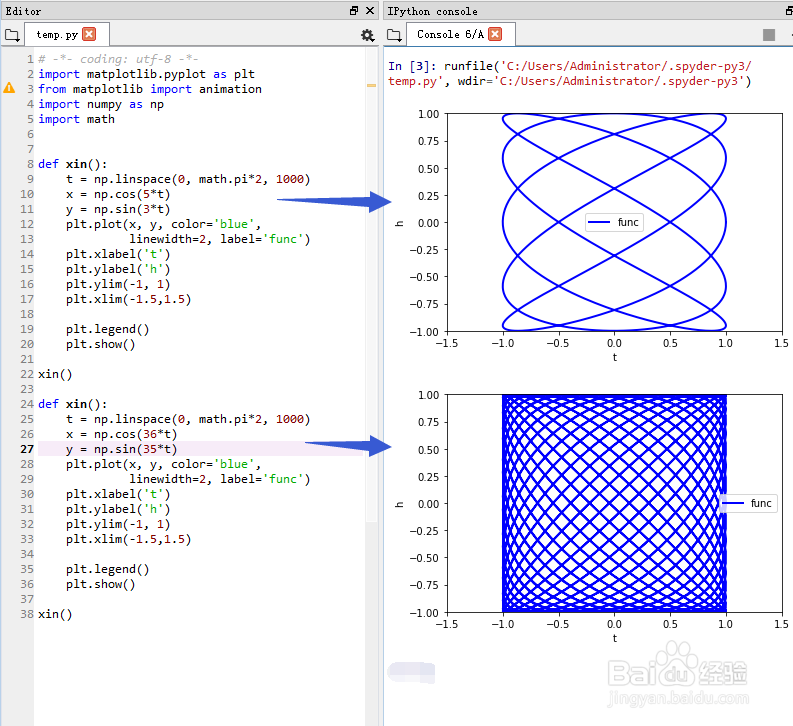
3、t = np.linspace(0, math.pi*2, 1000) 给出了参数方程的参数范围(0,2*pi)。
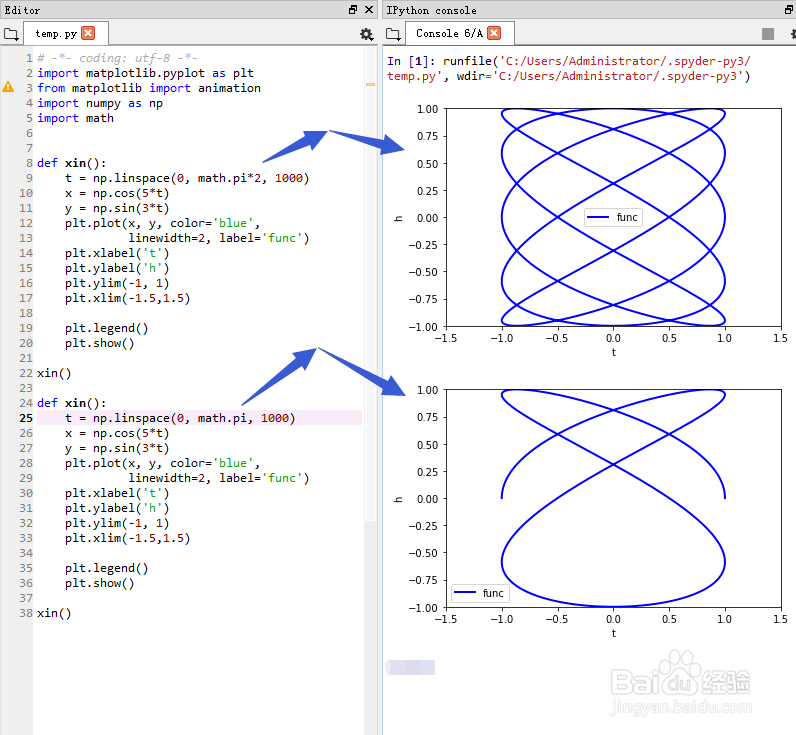
4、 x = np.cos(5*t)
y = np.sin(3*t)
这两行,给出了参数方程的表达式。
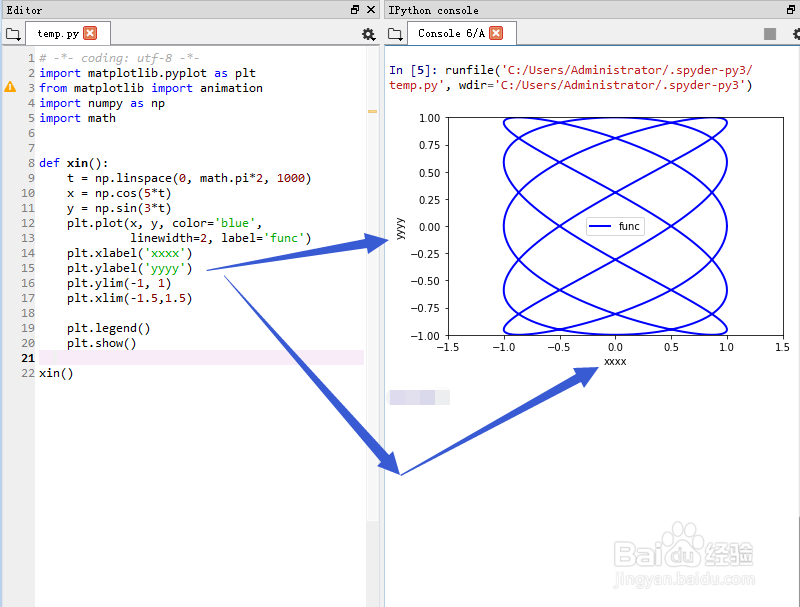
5、 plt.xlabel('t')
plt.ylabel('h')
给坐标轴加标签。
6、 plt.ylim(-2, 2)
plt.xlim(-1.5,1.5)
这种情况下,图形看起来被压扁了。

7、 plt.plot(x, y, color='blue',
linewidth=2, label='func')
这是作图,参数方程,颜色,线的宽度,图标。可是这个图标为什么乱跑呢?
