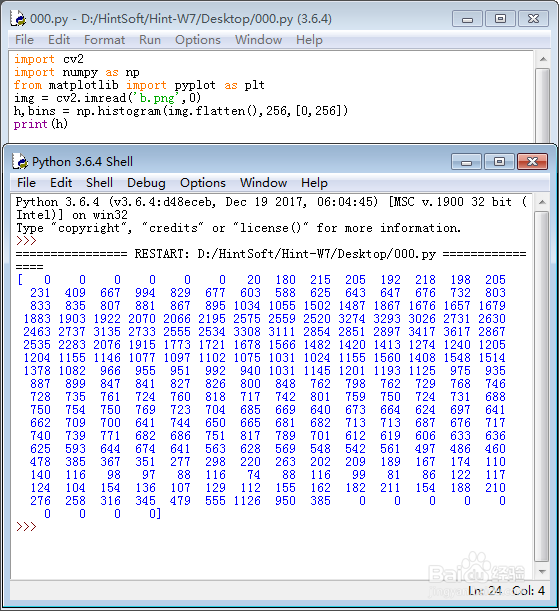
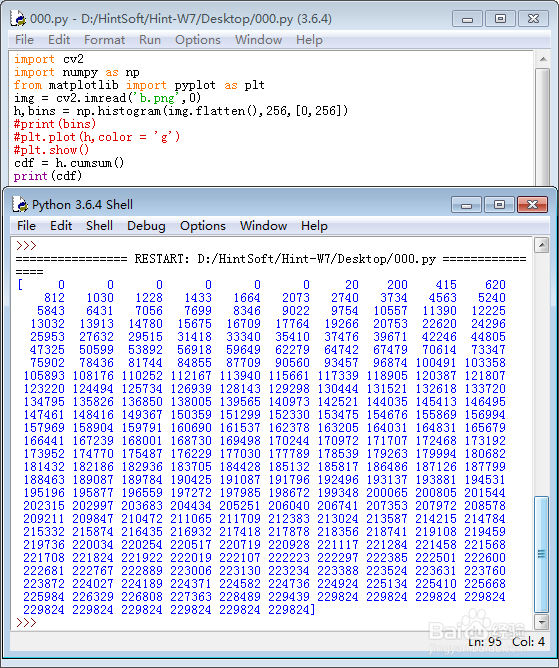
1、获取第一个通道的像素值统计数据:
import cv2
import numpy as np
from matplotlib import pyplot as plt
img = cv2.imread('b.png',0)
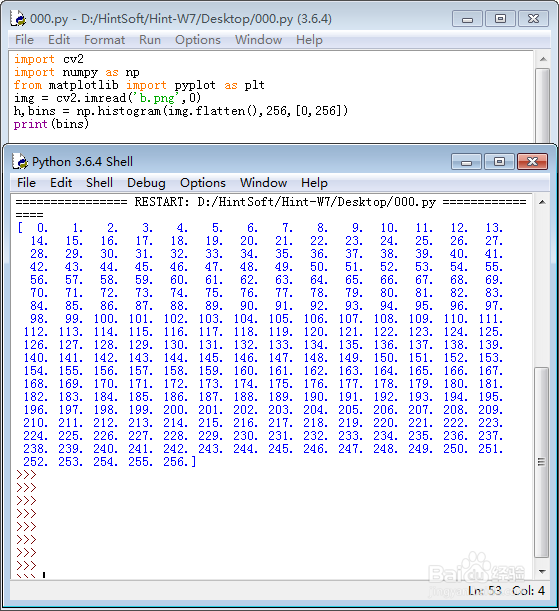
h,bins = np.histogram(img.flatten(),256,[0,256])
2、bins就是相应的亮度(像素值)。
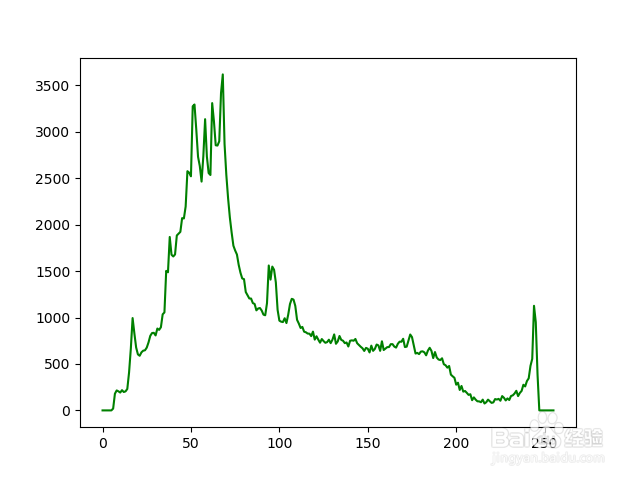
3、绘制直方图:
plt.plot(h,color = 'g')
这是第一个通道,但是使用绿色。
4、累计小于某个像素值的像素数目:
cdf = h.cumsum()
嗯,cdf里面的数字只会递增或持平,不会下降。
5、把这个累计图画出来:
plt.plot(cdf,color = 'g')
plt.show()

6、把累计图压扁:
cdf_normalized = cdf*h.max()/cdf.max()
把压扁的累计图和直方图画到一起:
plt.plot(h, color = 'g')
plt.plot(cdf_normalized, color = 'b')


7、用orange来填充直方图:
plt.plot(h, color = 'g')
plt.plot(cdf_normalized, color = 'b')
plt.hist(img.flatten(),256,[0,256], color = 'orange')

8、增高原图的对比度:
cdf_m = np.ma.masked_equal(cdf,0)
cdf_m = (cdf_m - cdf_m.min())*255/(cdf_m.max()-cdf_m.min())
cdf = np.ma.filled(cdf_m,0).astype('uint8')
img2 = cdf[img]
cv2.imwrite('g.png',img2)

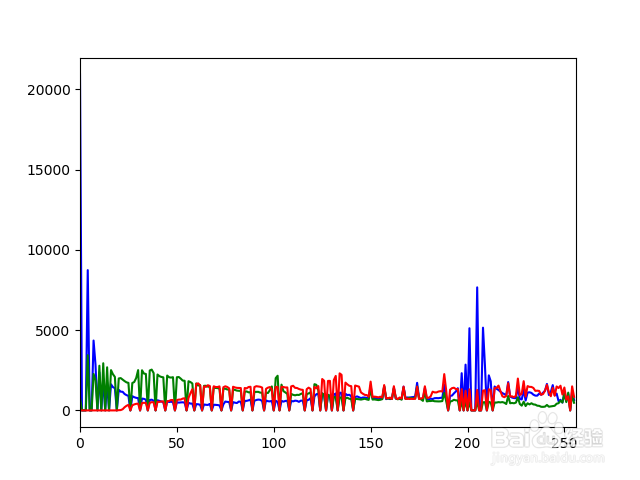
9、我们看看原图“b.png”的直方图。

10、在看看g.png的直方图。